BWI Balance Line (strange attractors) trading indicator short info
"We have now arrived at our fifth and final trading dimension. At first, this dimension may seem a bit more complicated, but it really isn’t. Its purpose was to get us into a trade before the fractal breakout signal. This has been profitable throughout the years we have used it, but we have now refined this signal to be even more effective, yielding greater profits and fewer whiplashes.The Balance Line is where the price would be if there was no new incoming information (Chaos) affecting the market at the present time."
© Bill Williams. "Trading Chaos" see book...
Indicator:
- Implements 5th dimension "Chaos trading system" (by Bill Williams)
- Shows where price would be if there was no new incoming information (Chaos)
- Shows active trading signals only
- Easy to customize
- Has presets
Appearance of the BWI Balance Line indicator
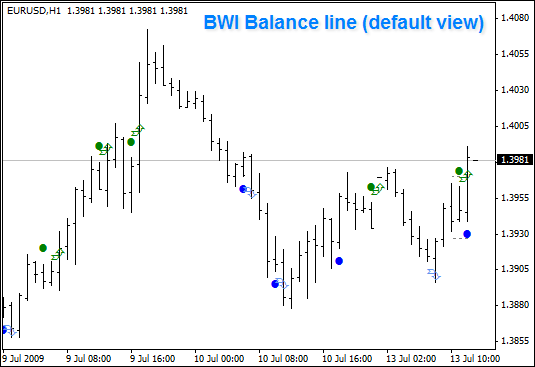
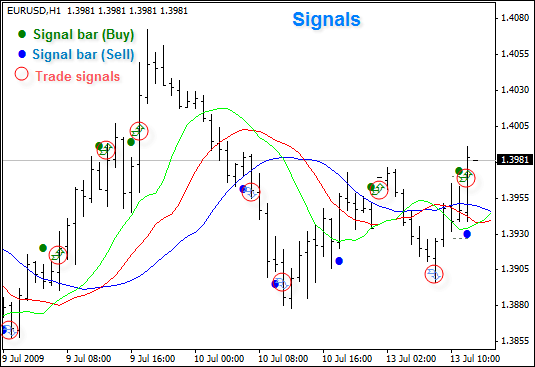
How to Use - the BWI Balance Line trading signals
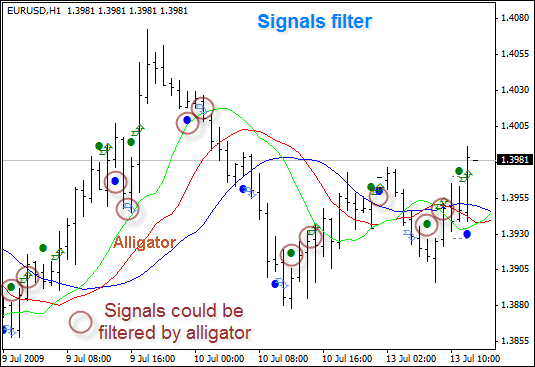
How to Use - BWI Balance Line trading signals filter
General Information about Balance Line
Balance Line Trades Overview
Balance Line trades is the fifth market dimension. The Balance Line is the line where the price would be if there were no new incoming information (Chaos) affecting the market. Mathematical calculations and computerised model analyses helped Bill Williams to find the Balance Line and build a histogram, which can be used to define the distance between the price and the Balance Line. To his surprise, Bill Williams found that this distance can be defined by the Awesome Oscillator histogram.
Whenever new information comes into the market, it is easier (takes less energy) for the price to move away from the Balance line than to move towards it ("it is easier to go downhill than uphill").
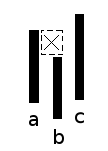
New information on the price chart
The idea of the fifth dimension:
- Buyers are weaker on the "b" bar in comparison to the "a" bar. It proves that the "b" bar’s high is lower than the "a" bar’s high.
- Why are sellers stronger on the "b" bar? The reason for this is that new information came to the market (on the picture it is shown as a dashed square) and changed the balance.
- If buyers become stronger and raise the market (refer to the "c" bar) to the "a" bar’s high, this means that the market balance is changing and it may be a first signal to make a deal within the fifth dimension.
Bar "b" is the base bar:
- Base bar for a signal to buy is the most recent bar whose high is lower than the preceding bar’s high ("b" bar in the figure above). It may be the current bar; for example, "b" bar when there is no "c" bar yet.
- Base bar for a signal to sell is the most recent bar whose low is higher than the preceding bar’s low (it may be the current bar).
The first three principles of Balance Line trades:
- 1) Read the chart from right to left.
- 2) If you are waiting for a buy signal, look at the highs only. If you are waiting for a sell signal, look at the bottoms only.
- 3) Establish the base bar first (as described above).
If you have found a base bar for a buy or sell signal then you are halfway to making a deal within the fifth dimension.
It should be noted that you shouldn’t open positions using signals from the 2-5 dimensions before the first signal is generated when the first fractal is triggered. Also, you should only use signals that are in the same direction of the first signal.
Buy Signal Above the Balance Line
If the price is above the Balance Line and you wait for a signal to buy, then you expect that the price will move away from the Balance Line (go "downhill").
Principle 4:
- 4) if you move away from the Balance Line then you need one more new high (low) to buy (sell). If instead, you move towards the Balance Line, then you need two new highs (lows).
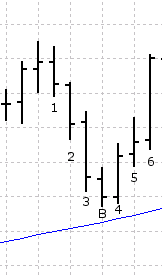
Buy signal above the Balance Line
Following this principle, for a buy signal you need to wait for the price to rise above the high of the closest preceding bar whose top is higher than that of the base bar:
Let’s assume that on the price chart you see bar "1" and all the preceding bars. Hence, you cannot see bars "2", "3", "4" etc yet. At this point, bar "1" can be defined as the base bar for a signal to buy as it is the most recent bar whose high is lower than that of the preceding bar.
The main principle of the Buy signal above the Balance Line is that a Buy Stop order has to be placed 1 tick above the high of the bar that precedes the base bar (in our case it is bar "1").
Bar "2" occurs on the chart with the high that is lower than that of bar "1"; so, bar "2" becomes the base bar. The Pending order has to be deleted and a new Buy Stop must be placed 1 tick above the top of bar "1" (the bar that precedes the base bar "2"). The same happens on bar "3" and bar "B". Once bar "B" has appeared it becomes the base bar, and the pending order has to be placed 1 tick above the high of bar "3".
After that bar "4" occurs, but bar "B" is still the base bar, i.e. if you read from right to left, this bar is the first with the high lower than that of the preceding bar. The high of bar "4" is lower than the pending order, so you are not in the market yet. Bar "5" occurs, the base bar remains the same and the pending order is not triggered. But then bar "6" appears and its top is higher then that of the bar which precedes the base bar, so your Buy Stop is triggered and you enter the market following the Buy signal above the Balance Line.
Buy Signal Below the Balance Line
Obviously, if you buy below the Balance Line you hope that the price will move closer to the Balance Line (go "uphill"). Remember principle 4:
- 4) If you move away from the Balance Line then you need one more new high (low) to buy (sell). If instead, you move towards the Balance Line, then you need two new highs (lows).
This means that you need two highs to get the Buy signal below the Balance Line:
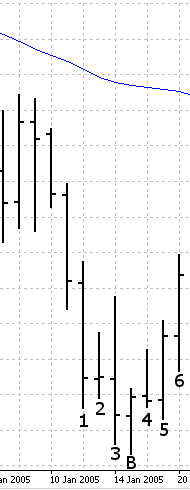
Buy signal below the Balance Line
If bar "B" occurs it becomes the base bar, as it is the first bar whose high is lower than that of the preceding bar if you read the chart from right to left. In order to generate a Buy signal below the Balance Line you need two highs to the left of bar B. The first of these is bar "3". Bar "2" will not meet our requirements, as its high is lower that of bar "3". Bar "1" is the second high you are looking for because its high is above than that of bar "3". That is why you must place a Buy Stop 1 tick above the high of bar "1".
When bar "4" occurs nothing changes: the base bar is still bar "B" and the pending order has not been triggered. Bar "5" changes nothing again. When bar "6" occurs the pending order is triggered and the Buy signal below the Balance Line is generated.
Sell Signal Below the Balance Line
Sell signal below the Balance Line has the same principles as the Buy signal above the Balance Line. In both cases you hope that the price will move away form the Balance Line. Following principle 4 (described above) you need to have one low to generate a signal:
Sell signal below the Balance Line
Let’s assume that on the price chart you see bar "B" and all the preceding bars. If you read the chart from right to left, then bar "B" is the base bar, i.e. the most recent bar whose bottom is higher than that of the preceding bar. As you only need one lower bottom you can place a Sell Stop order 1 tick below the low of bar "1". Nothing changes when bar "2" occurs: bar "B" is still the base bar and the pending order has not been triggered. Bar "3" also does not change the situation.
You should remember that if any of the subsequent bars (before Sell Stop is triggered) becomes the base bar, the previous signal has to be ignored, and the previously placed pending order has to be deleted. In our case, this has not happened yet. When bar "4" occurs, the pending order is triggered and the Sell signal below the Balance Line is generated.
Sell Signal Above the Balance Line
Sell signal above the Balance Line has the same principles as Buy signal below the Balance Line:
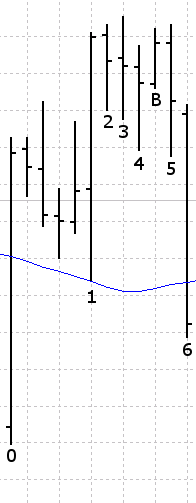
Sell signal above the Balance Line
In both cases you hope that the price will move towards the Balance Line (go "uphill"). Following principle 4, you need to have two lows to generate a signal.
Let’s assume that on the chart you see bar "2" and all the preceding bars. Bar "2" is considered to be the base bar, i.e. it is the first bar (if you read the chart from right to left) whose bottom is higher than that of the preceding bar. As the price tends to move towards the Balance Line, you need to find two lows to generate a signal:
- First bar right to left, whose bottom is lower than that of the base bar. This is bar "1".
- First bar right to left, whose bottom is lower than that of the bar "1". This is bar "0".
This is why after bar "2" appears, you should place a Sell Stop order 1 tick below the bottom of bar "0". When bars "3" and "4" occur nothing changes: bar "2" keeps the status of the base bar and the pending order has not been triggered yet.
Once bar "B" appears:
- It becomes the base bar and the pending order, placed 1 tick below bar "0", has to be deleted.
- A new Sell Stop order has to be placed 1 tick below the bottom of bar "1" (the bottom of bar "4" is lower than the bottom of the base bar "B", and the bottom of bar "1" is lower than the bottom of bar "4").
- The pending order will be triggered on bar "6" and the Sell signal above the Balance Line is generated.
No matter what signal is created you must ignore it until the first fractal buy or sell signal is triggered outside the Alligator’s mouth.
You should ignore signals which are not in the same direction as the first signal generated from fractal.
For all the signals of the fifth dimension there are two principles which will help you recognize false signals:
- Never sell above or buy below Alligator’s mouth.
- If the current bar is in the Red or Green Zone (refer to the "Trading in the Zone" page), double the number of new higher tops (lower bottoms) that are required to create a buy (sell) signal.
Source: Alpari.co.uk


