BWI Zone (phase energy/force combination) trading indicator short info
"Everything is going our way whenever the Momentum is in the same direction as our trade and the Momentum is Accelerating in our direction. The final confirmation comes when the traders take the Price in our direction. In other words, we have the Momentum in our favor, it is Accelerating in our direction, and the Price is closing in our direction. This gives us an absolute MAP for profits."
© Bill Williams. "Trading Chaos" see book...
Indicator:
Appearance of the BWI Zone

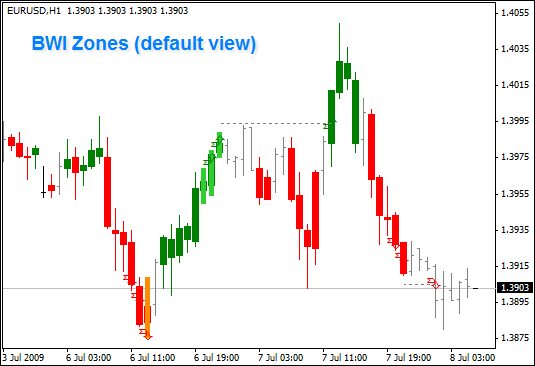
On the image you can see default view of the BWI Zone indicator.
(As soon as you have added it to a chart.)
BWI Zone use simple rules:
if AO and AC goes up – display green bar, goes down – red bar;
it means market has strong up or down trend;
if AO and AC goes in opposite directions – leave bar grey;
it means market has no trend;
if there are more than 5 (number can be adjusted) new bars will be marked by light green or orange colors;
It means market can change It direction soon and trader should be careful in his actions.
Also BWI Zone has its own trading signal. It is displayed as a dotted line. After the appearance of the signal trader should wait for breakout (displayed as arrow) and after that placing an order or place pending order on that line. The signal will appear over bar’s maximum (or lower than bar’s minimum) on certain number of pips (in the original 1 pips).
Appearance, colors, etc. and etc. trader can adjust using properties of the indicator.
How to Use - BWI Zone trading signals

General Information about zones
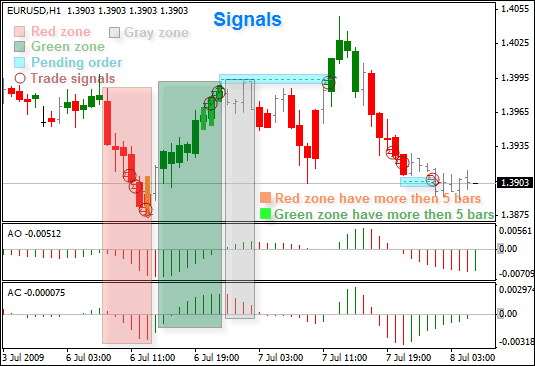
- If both histogram bars (AC and AO) are green, this is defined as the Green Zone (a very bullish market).
- When both are red this is the Red Zone (a very bearish market).
- If histogram bars point in opposite directions then it is the Gray Zone (market is in transition).
In order to open a new long positions in the Green Zone (short positions in the Red Zone) you need to have at least two consecutive green (red) bars, and the close price of the second bar must be higher (lower) than the closing price of the preceding one.
However, we stop adding on to the Zone after five consecutive green or red histogram bars , as it is unusual for the market to have more than 6-8 bars of one colour. After the fifth green (red) histogram bar has occured, place a Stop Loss order one tick below the low (above the high) of the fifth bar. If the stop order is not executed on the next bar, then you should change it one tick below the low (above the high) of the sixth bar etc.
The zone does three things for us:
1) Allow us to get aggressive at the market.
2) Gives us a great profit talking technique.
3) Adjust the Balance Line Signal in the different Zones.


